RESULTS OF WATER DEMAND STUDY FOR LAKE DURANGO WATER COMPANY, APRIL 2007
Municipal water systems have three types of water to manage:
(1) Raw water from the source; (2) Treated water delivered to customers; and (3) Consumed water used by the customers (Figure 1). For Lake Durango Water Company (LDWC), the raw water is conveyed through the Pine Ridge Ditch and stored in Lake Durango. Treated water is the volume treated by the treatment plant. Consumed water is delivered to customers in the rural areas west of Durango, Colorado. Water use is usually described as water consumed by the customers. However, water use also can include reservoir evaporation, reservoir seepage losses, and distribution losses in the piping systems.
Safe Yield and Water Demand
Safe yield of a water system is typically defined as the amount of water that a drainage basin or reservoir can safely provide during dry periods. In La Plata County, the safe yield of a water system has ordinarily been calculated by using an assumed demand of 350 gallons per day per house. The number of houses (or water taps) is multiplied by 350 gal/d/tap to calculate the amount of water that is needed annually for a water system.
The La Plata County Water Commission has submitted draft water supply standards indicating that, alternatively, a water demand study may be prepared in order to quantify the amount of water that will reasonably be required to serve the customers of a water system. A water demand study for a water system may be based on the actual usage data if there is 10 consecutive years of reliable data from which to estimate water use per unit. The actual usage data may be the basis for determining the water supply needed for existing homes and any new homes proposed to be added to the system (La Plata County Water Commission, Draft Water Supply Standards, April 3, 2007). This fact sheet presents results from the LDWC water demand study


Historical LDWC Customers
During 1996-2006, the customer base for LDWC has grown by about 2 to 6 percent each year for 10 years (Table 1). The lowest growth rate occurred during 2004-06 when restrictions on development were placed by La Plata County on subdivisions within the LDWC service area.
Historical LDWC Water Use
The amounts of water delivered from the treatment plant to customers is reported by LDWC to the State of Colorado each month, and the data are available from the Colorado Division of Water Resources website (http:// cdss.state.co.us/). The data for Johnson PS, reported in acre-feet per month on the DWR website, were converted to gallons per day per tap according to the customer numbers shown in Table 1. During 1996-2006, the ten-year average for treated water delivered to LDWC customers was 229 gal/d/tap (Figure 2).


During January 1996-June 2002, the water demand prior to the drought of 2002-03 was 279 gal/d/tap (Figure 2). Conservation-incentive rates were put into place during 2003 by the Colorado Public Utilities Commission (PUC). The tiered rate structure imposes higher water costs as consumption increases. Much less water has been consumed by LDWC water users since the conservation rates were put into place, and the average water demand during 2002- 2006 was 154 gal/d/tap (Figure 2).
Data regarding water consumed by LDWC customers is available in hard copies of billing reports in the LDWC office. During 2003-06, the water consumed by LDWC customers ranged from 63 to 341 gal/d/tap, and the average was 114 gal/d/tap (Figure 3). By excluding the high value of 341 gal/d/tap, which may have been due to a water leak, the average water consumed by LDWC customers was 109 gal/d/tap.


Reservoir Levels During Drought
There are currently 1,435 active and committed taps in the LDWC tap count. To best method to calculate safe yield of the LDWC water system would utilize the actual water demand of the LDWC water system and to simulate the reservoir levels during the drought of 2002-03 for the 1,435 customers. Using a spreadsheet program developed by Southwest Hydro-Logic and modified by Harris Water Engineering, the reservoir simulation includes actual diversions from the Pine Ridge Ditch, snowmelt runoff, lake evaporation, distribution losses, and conservation savings. Using the average delivery of treated water of 154 gal/d/tap, 25 percent distribution losses, and an 80 percent conservation savings due to drought incentives, the simulation indicates that the reservoir would have 329 acre-feet of water at the end of the drought in August 2003 (Figure 4).
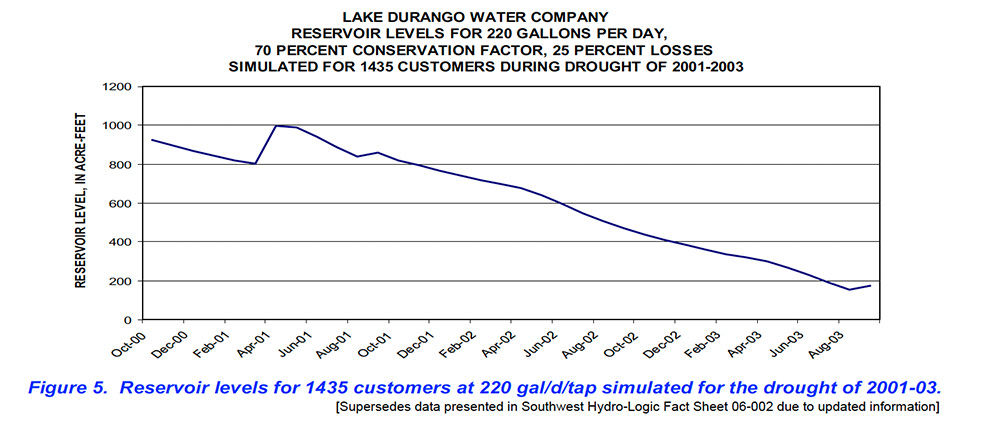
Water demand in a water system includes more than just the water consumed by customers. Demand can include water for fire fighting, sufficient water in case of a water leak or pipeline break, and extended droughts. Rather than the base value of 154 gal/d/tap that was actually used by LDWC customers, it is suggested that 220 gal/d/tap is a more realistic value. Reservoir simulation using 220 gal/d/tap, 25 percent distribution losses, and a 70 percent conservation savings indicates that the reservoir would have 154 acre-feet of water at the end of the drought in August 2003 (Figure 5).
Effectiveness of Conservation Rates and Improvements
A conservation-incentive water rate structure was implemented by LDWC through the PUC Decision R03-1022A. The conservation rate structure includes higher costs per 1,000 gallons as consumption increases; prices for retail customers are greater than prices for bulk customers (Table 2). Bulk customers include Durango West Metropolitan District No. 1, Durango West Metropolitan District No. 2, and La Vista Estates. Retail customers include private individuals and households within the LDWC service area.

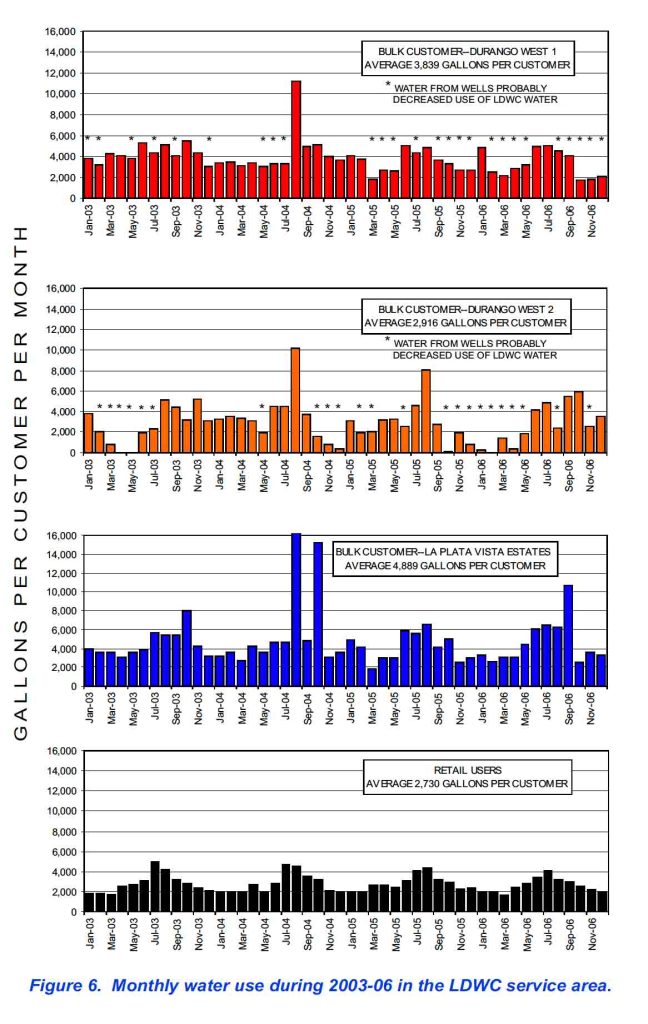
Water rates for retail customers are as high as 2.2 times greater than rates for bulk customers. The end result has been that there are no pricing incentives for bulk customers to use less water. During 2003-06, average water use by bulk customers ranged from 2,918 to 4,889 gallons per customer per month (Figure 6). During some months, water from bulk customer’s wells within their water system decreased use of LDWC water (Figure 6). Average water use by retail customers was 2,730 gallons per customer per month (Figure 6). Revenues from water use greater than 6,000 gallons per month are deposited into the LDWC Capital Improvement Fund (CIF) account. Since the bulk customer water use is averaged over the entire bulk customer base, and the average water use by bulk customers has rarely been above 6,000 gallons per month, the bulk customers have contributed little or no revenue into the CIF account.
Since the drought of 2002, improvements have been done to the Pine Ridge Ditch and LDWC system infrastructure. The conservation incentive rates and improvements have resulted in higher reservoir levels. During the impending drought of March 2002, the reservoir level was near 600 acre-feet of storage. During March 2007, the snowpack levels were almost as low as during 2002, and the reservoir level was at 932 acre-feet of storage. This is, in part, due to the diligent efforts of the Colorado Division of Water Resources, but also reflects the efforts of LDWC to meet customer needs.
